Community articles — Reports
Write up experiments and research with LaTeX templates for project and lab reports—including layout guidelines to help guide you through the writing process.
Recent

Principal Components Analysis (PCA) and Canonical Correlation Analysis (CCA) are among the methods used in Multivariate Data Analysis. PCA is concerned with explaining the variance-covariance structure of a set of variables through a few linear combinations of these variables. Its general objectives are data reduction and interpretation. CCA seeks to identify and quantify the associations between two sets of variables i.e Pulp fibres and Paper variables.PCA shows that the first PC already exceeds 90% of the total variability. According to the proportion of variability explained by each canonical variable , the results suggest that the first two canonical correlations seem to be sufficient to explain the structure between Pulp and Paper characteristics with 98.86%. Despite the fact that the first the two canonical variables keep 98% of common variability, 78% was kept in the pulp fiber set and about 94% of the paper set as a whole. In the proportion of opposite canonical variable,there were approximately 64% for the paper set of variables and 78% for the pulp fiber set of variables kept for the two respectively.
With the emergence of systems archiving and distribution of PACS medical imaging, also emerged the need to store those images off-site environment, this project aims to study this need, trying to offer a service within an information infrastructure that can integrate the environment site with a remote environment, a transparent and heterogeneous, taking account of the needs of users of teleradiology. Keywords: PACS, teleradiology, Medical Imaging, Archiving.
Benford law states that the occurrence of digits from 0-9 in a large set of data is not uniformly distributed but instead in a decreasing logarithmic distribution with 1 occurring at most. Almost all set of data follows this trend however this law is widely used as a base for various fraud detection and forensic accounting. Benford’s law is an observation that leading digits in data derived from measurements doesn’t follow uniform distribution. Different financial statements such as cash flows, income statement and balance sheet of the 20 tech companies of the Fortune 500 are analyzed in this project. Cash flow is the net amount of cash and cash-equivalents moving into and out of a business. Income statement is a financial statement that measures a company's financial performance over a specific accounting period. Balance sheet is a financial statement that summarizes a company's assets, liabilities and shareholders’ equity at a specific point in time. All of these data of financial statements are extracted from Morning Star database and are analyzed by Python program written by me.I also wrote the Python program to calculate Benford's second digit and third digit probability using the formula. I would like to thank Prof. Erin Wagner and Dr. Courtney Taylor for helping in this research project.
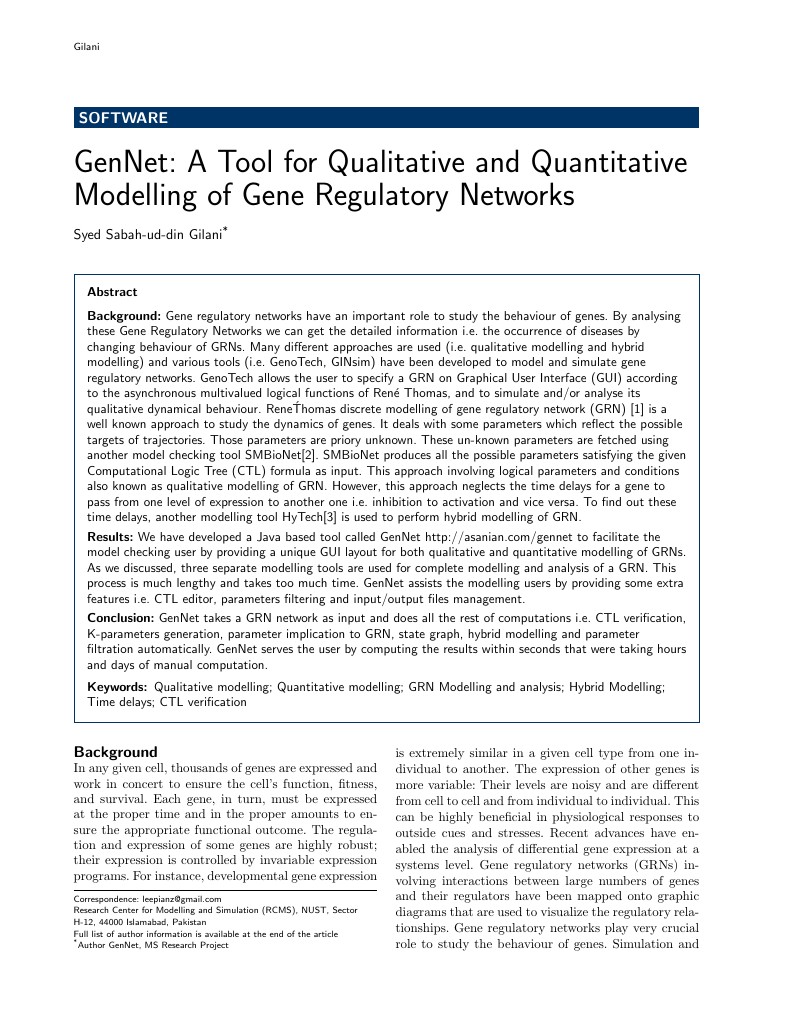
Gene regulatory networks have an important role to study the behaviour of genes. By analysing these Gene Regulatory Networks we can get the detailed information i.e. the occurrence of diseases by changing behaviour of GRNs. Many different approaches are used (i.e. qualitative modelling and hybrid modelling) and various tools (i.e. GenoTech, GINsim) have been developed to model and simulate gene regulatory networks. GenoTech allows the user to specify a GRN on Graphical User Interface (GUI) according to the asynchronous multivalued logical functions of René Thomas, and to simulate and/or analyse its qualitative dynamical behaviour. René Thomas discrete modelling of gene regulatory network (GRN) is a well known approach to study the dynamics of genes. It deals with some parameters which reflect the possible targets of trajectories. Those parameters are priory unknown. These unknown parameters are fetched using another model checking tool SMBioNet. SMBioNet produces all the possible parameters satisfying the given Computational Logic Tree (CTL) formula as input. This approach involving logical parameters and conditions also known as qualitative modelling of GRN. However, this approach neglects the time delays for a gene to pass from one level of expression to another one i.e. inhibition to activation and vice versa. To find out these time delays, another modelling tool HyTech is used to perform hybrid modelling of GRN. We have developed a Java based tool called GenNet http://asanian.com/gennet to facilitate the model checking user by providing a unique GUI layout for both qualitative and quantitative modelling of GRNs. As we discussed, three separate modelling tools are used for complete modelling and analysis of a GRN. This process is much lengthy and takes too much time. GenNet assists the modelling users by providing some extra features i.e. CTL editor, parameters filtering and input/output files management. GenNet takes a GRN network as input and does all the rest of computations i.e. CTL verification, K-parameters generation, parameter implication to GRN, state graph, hybrid modelling and parameter filtration automatically. GenNet serves the user by computing the results within seconds that were taking hours and days of manual computation
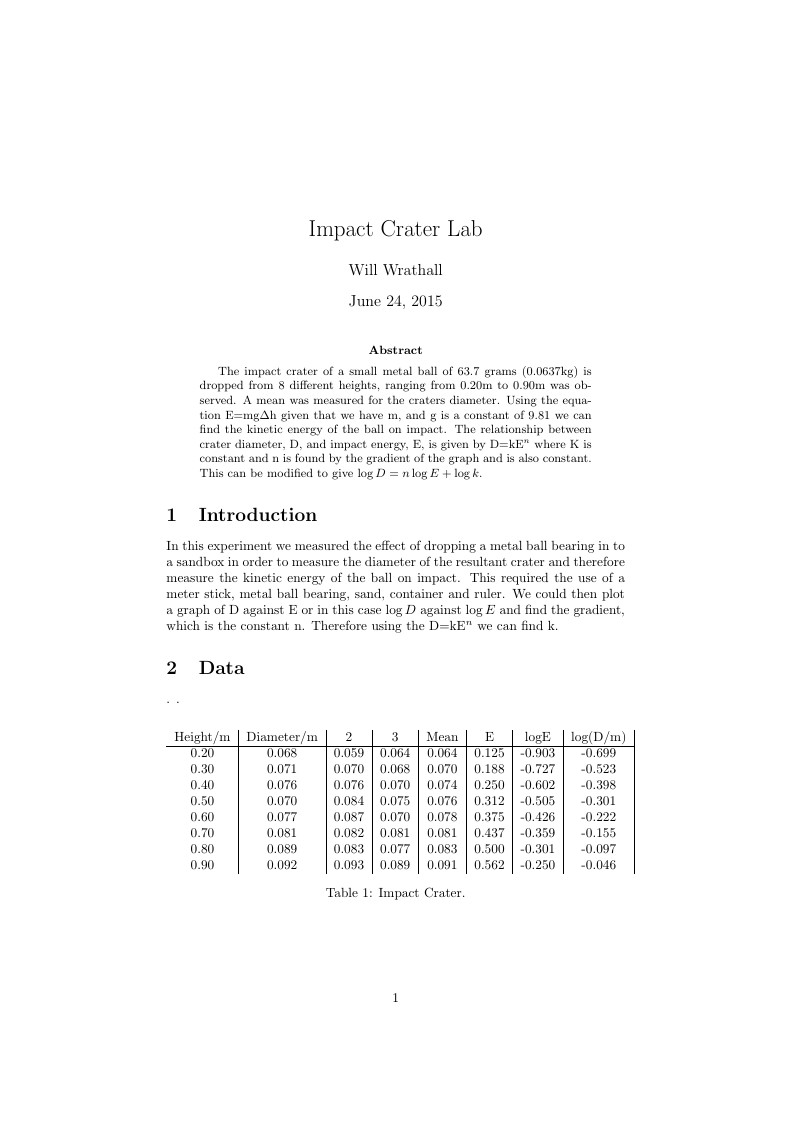
The impact crater of a small metal ball of 63.7 grams (0.0637kg) is dropped from 8 different heights, ranging from 0.20m to 0.90m was observed. A mean was measured for the craters diameter. Using the equation E=mg$\Delta$h given that we have m, and g is a constant of 9.81 we can find the kinetic energy of the ball on impact. The relationship between crater diameter, D, and impact energy, E, is given by D=kE$^n$ where K is constant and n is found by the gradient of the graph and is also constant. This can be modified to give $\log D = n\log E + \log k$.

Its about a tutorial on Stack - a very popular data structure ...
A comprehensive report on Data Analysis and Machine Learning project on Listings of Seattle City. Drawing important analytic and visualizing inferences on the data set using analysis and visualization tools. And predicting future price of listings based on common features.
Throughout the ECE Lab section we have learnt many electronics concepts and applied almost all of them directly or indirectly in our final lab project. Additionally, having taken away a lot from this course, we aimed to make a project that would challenge us academically and intellectually; for our final lab assignment, we made an autonomous line-following robot, that would follow a white line track using RedBot sensors, and would respond to audio cues from the environment using a microphone. In this report, we explain the use of each of the components that were used to make the final vehicle and the working of the vehicle itself.

Xi’an Jiaotong University experiment report
\begin
Discover why over 25 million people worldwide trust Overleaf with their work.