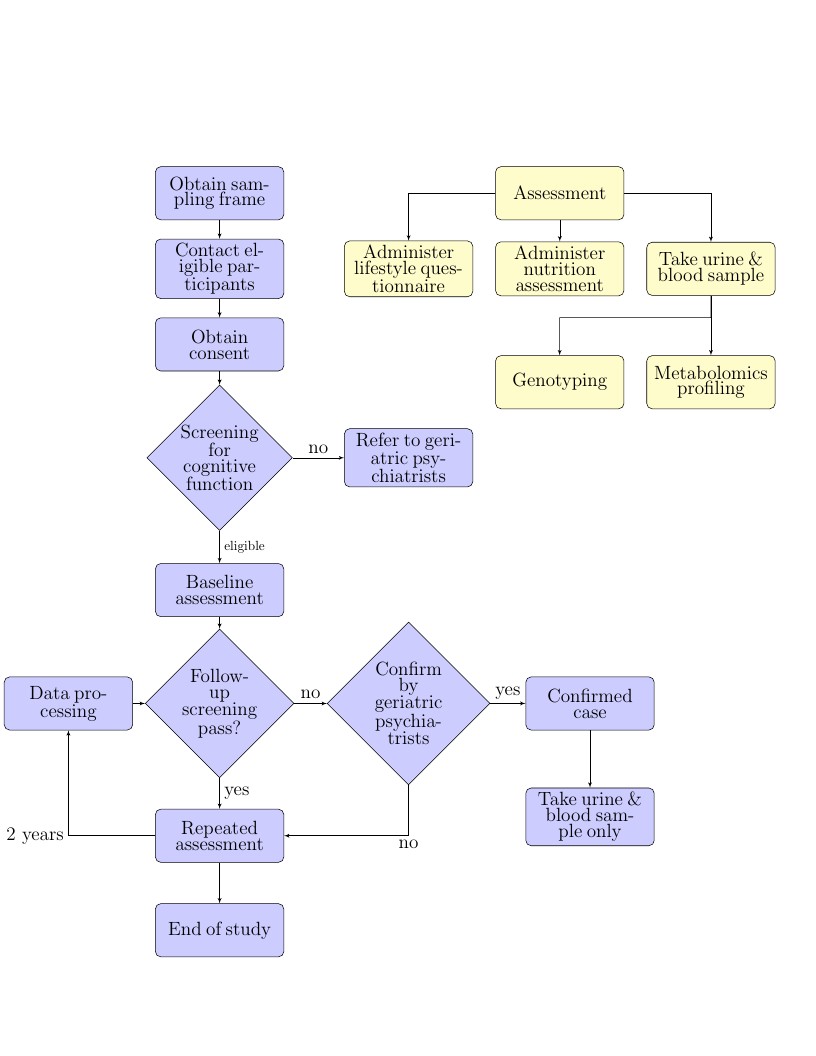
tikz flowchart of an epidemiology study
Author:
lbw
Last Updated:
há 12 anos
License:
Creative Commons CC BY 4.0
Abstract:
tikz flowchart of an epidemiology study

\begin
Discover why over 25 million people worldwide trust Overleaf with their work.

\begin
Discover why over 25 million people worldwide trust Overleaf with their work.
\documentclass{article}

\usepackage[latin1]{inputenc}
\usepackage{tikz}
\usetikzlibrary{shapes,arrows}
\begin{document}
\pagestyle{empty}


% Define block styles
\tikzstyle{decision} = [diamond, draw, fill=blue!20,
text width=6em, text badly centered, node distance=3cm, inner sep=0pt]
\tikzstyle{block} = [rectangle, draw, fill=blue!20,
text width=9em, text centered, rounded corners, minimum height=4em]
\tikzstyle{block2} = [rectangle, draw, fill=yellow!20,
text width=9em, text centered, rounded corners, minimum height=4em]
\tikzstyle{line} = [draw, -latex']
\tikzstyle{cloud} = [draw, ellipse,fill=red!20, node distance=3cm,
minimum height=4em]

\begin{figure}[!ht]
  \centering
  \hspace*{-135pt}
  \begin{tikzpicture}[node distance = 2cm, auto]
    % nodes
    \node [block] (init) {\Large Obtain sampling frame};
    \node [block, below of = init] (contact) {\Large Contact eligible participants};
    \node [block, below of = contact] (consent) {\Large Obtain consent};
    \node [decision, below of = consent] (screening) {\Large Screening for cognitive function};
    \node [block, right of = screening, node distance = 5cm] (refer) {\Large Refer to geriatric psychiatrists};
    \node [block, below of = screening, node distance = 3.5cm] (assess0) {\Large Baseline assessment};
    \node [block2, right of = contact, node distance = 5cm] (lifestyle) {\Large Administer lifestyle questionnaire};
    \node [block2, right of = lifestyle, node distance = 4cm] (nutrition) {\Large Administer nutrition assessment};
    \node [block2, right of = nutrition, node distance = 4cm] (blood) {\Large Take urine \& blood sample};
    \node [block2, below of = nutrition, node distance = 3cm] (genetics) {\Large Genotyping};
    \node [block2, below of = blood, node distance = 3cm] (metabolomics) {\Large Metabolomics profiling};
    \node [block2, above of = nutrition] (assess) {\Large Assessment};
    \node [decision, below of = assess0, node distance = 3cm] (followup) {\Large Follow-up screening pass?};
    \node [decision, right of = followup, node distance = 5cm] (confirm){\Large Confirm by geriatric psychiatrists};
    \node [block, right of = confirm, node distance = 4.8cm] (case){\Large Confirmed case};
    \node [block, below of = followup, node distance = 3.5cm] (assessn) {\Large Repeated assessment};
    \node [block, left of = followup, node distance = 4cm] (interval) {\Large Data processing};
    \node [block, below of = assessn, node distance = 2.5cm] (end) {\Large End of study};
    \node [block, below of = case, node distance = 3cm] (bloodcase) {\Large Take urine \& blood sample only};
    % edges
    \path [line] (init) -- (contact);
    \path [line] (contact) -- (consent);
    \path [line] (consent) -- (screening);
    \path [line] (screening) -- node {eligible}(assess0);
    \path [line] (screening) -- node {\Large no}(refer);
    \path [line] (assess) -| (lifestyle);
    \path [line] (assess) -- (nutrition);
    \path [line] (assess) -| (blood);
    \path [line] (blood) -- (metabolomics);
    \path [line] (blood) |- ([xshift = -2.3cm, yshift = 1cm]metabolomics.north west) -- (genetics);
    \path [line] (assess0) -- (followup);
    \path [line] (followup) -- node {\Large no}(confirm);
    \path [line] (followup) -- node {\Large yes}(assessn);
    \path [line] (assessn) -| node {\Large 2 years}(interval);
    \path [line] (interval) -- (followup);
    \path [line] (confirm) -- node {\Large yes}(case);
    \path [line] (confirm) |- node {\Large no}(assessn);
    \path [line] (assessn) -- (end);
    \path [line] (case) -- (bloodcase);
  \end{tikzpicture}
\end{figure}

\end{document}